Table of Contents
Share This Article :-
Have you paid attention to consumers’ behaviour? What are the triggering points that lead them to convert? Which touchpoints lead to conversion along consumers’ journey?Taking an account of consumers’ journey is a difficult task.
Comparing attribution models provides you detailed analysis of consumers psychology and journey.You can analyse easily which attribution models perform well and maximise your ROI.
This blog is a complete guide about comparing attribution models.How can you compare different models? What tools are helpful regarding this and factors necessary for comparing attribution models.
What is the Comparing Attribution Model?
Comparing attribution models is a technique that is used to analyse different models for giving credits. In marketing analytics, credit is given for conversions along multiple touchpoints in the consumer’s journey.
This provides a clearer understanding of which channels genuinely influence customers throughout their journey, rather than solely at the final stage Comparing attribution models gives you a broad concept of marketing. It plays a crucial role in allocating the budget.
Comparing attribution models offers a clearer insight into what aspects of your marketing efforts are effective and which ones are not.
What are the different ways of comparing attribution models?
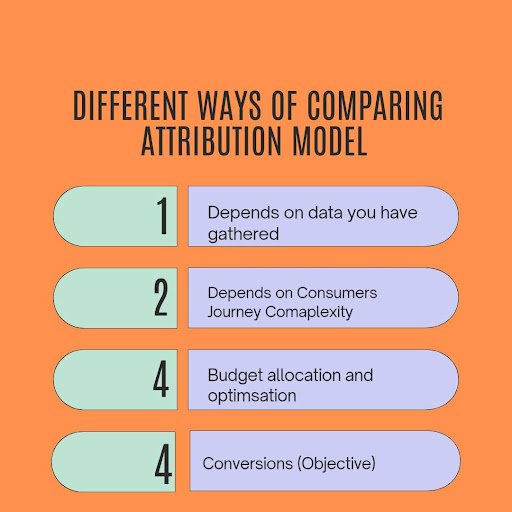
1. Depends on how much Data you have gathered
You have to keep a check on the data you are collecting and its accuracy. Every attribution model requires a certain amount of data. Attribution models vary in their reliance on data; some, like last-click or first-click models, operate effectively even with limited or incomplete data by focusing on either the most recent or the first touchpoint. If you possess extensive data and can track the entirety of the customer journey, opting for a more sophisticated attribution model like data-driven or multi-touch can be advantageous. Attribution models give credit depending on the influence of each point.
2. Depends on Customer's Journey Complexity
You have to keep a strong track of your customer’s conversion points.
What makes them curious? What makes them to take action?
You’ll gain insights into their individual touchpoints, such as ads clicked, emails opened, or social media posts engaged with. You can even map consumers’ journeys. A customer journey map visually represents the steps your customers take, starting from their initial interaction with your brand and continuing through to the final purchase, and potentially beyond. You can pinpoint the emotions, gaps, and opportunities, and figure out the effective ways to deliver the value to your customers.
3. Budget Allocation and optimisation
Attribution plays a crucial role in guiding where to invest for maximum ROI. Every penny matters in marketing. You can allocate your marketing budget by insights that you get while comparing the attribution model.
Comparing attribution models emerge different angles in front of you related to the same task. It keeps everything aligned with your audience by optimising your campaign.
4. Your Conversions (Objectives)
You can determine your goals related to paid media advertising campaigns. Various attribution models may align more effectively with distinct business objectives, including brand awareness, lead generation, or retention. Your attribution model. Your marketing attribution model acts as a bridge, connecting the dots between different marketing activities and the outcomes they produce. If you want to increase your sales, your sole focus should be on a last-click attribution model. You can improve your retention by preferring the time-decay model.
Different Attribution Models Comparison
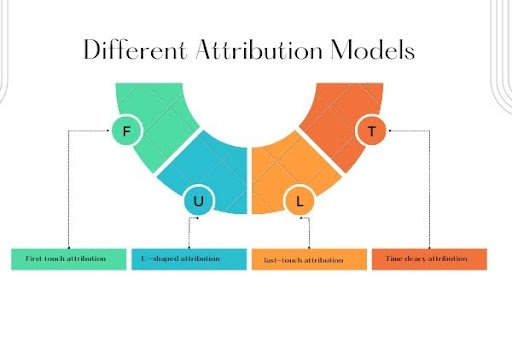
1. First-Touch Attribution Model
It gives all the credit of the purchase to the first interaction or the first touch point and the rest are ignored.
Pros
The first touch attribution model aids marketers in acknowledging their top-of-the-funnel marketing channels in the sales process. It tells which one touch point has firstly provided awareness and created interest in your product to make it in demand.
Cons
It neglects the influence of the other channels that may have caused the conversion and thus overlooks the synergy of grouped channels that may have led to the final purchase.
2. Last-Touch Attribution Model
This model holds the last touch point responsible for the conversion. In this measure, only the last interaction is considered and the other attributions that led to the last one are neglected.
Pros
This model leads to the acknowledgment of immediate conversion drivers and is significant for businesses having short sales cycles.
Cons
This method loses most of the data that has developed the pathway for the conversion and overvalues the last channel.
3. Time-Decay Attribution Model
This model gives more value to the touch points that are relatively closer in time to the conversion using the half life method i.e. the touch point that occurred one day before the conversion is valued more than that has occurred one week earlier.
Pros
It doesn’t neglect any of the interaction instead it may help to understand the network of touch points and channels. Thus it can be useful for complex customer journeys and large sales.
Cons
This model may have inaccuracies in determining the effect of touch points or interaction channels just based on time as many other factors of interest are not considered.
4. U-shaped Attribution Model
This model credits the touch points in such a way that the touch point on the left terminal is given the maximum credit and it decreases till the centre then it increases at the same rate it has decreased till it reaches the right terminal making the shape of alphabet U.
Pros
It is kind of a mixture of single-touch attribution model and time decay multi-touch attribution model and thus covers their pros including determining the possible immediate purchase driver and understanding the map of the touch point pathway
Cons
It involves the challenging task of providing credit to the most valuable interaction channel out of multiple touchpoints. Hence leading to the biasing or inaccuracy.
It provides equal status to the first and the last touch point ignoring many factors like customer’s psychology.
What is a model comparison report?
A model comparison report is the analysis document. In the model comparison report, different attribution models are compared to each other to know the best features, importance, significance, and pricing. It is performed to figure out new optimisation techniques by evaluating different attribution models.
The goal of a model comparison report is to assist consumers or decision-makers in making informed choices. It achieves this by presenting a thorough analysis of the differences and similarities among different options available in the market.
Analysing CPA and ROAs
1. CPA
There are various types of CPA model comparison reports. Let’s discuss a few of them.
- Last-interaction CPA
The average expense incurred in generating a conversion through a specific marketing campaign, utilising the last touch attribution model.
- Time decay CPA
This type of conversion gives most of the credit to the recent interaction before conversion. They won’t pay much heed to the past interactions. Time decay interaction accounts for half-life in exponential decay while calculating CPA.
- First -interaction CPA
First- interaction gives all the credit to the interaction on the conversion path. But the conversion should lie under 90 days. The attribution window in Google Analytics keeps the record of the first 90 days only.
2. ROAS
ROAS stands for return on ads spend. Combining investment and conversion metrics, Attribution Reports sheds light on profit margins and Return on Advertising Spend (ROAS) at various levels such as campaign, ad group, creative, or keyword.
Formula :
You can calculate your ads on return by :
Conversion Value/ Cost = Returns on Ad
3. ROAS and Google Ads
To gauge ROAS and access this metric within Google Ads, integrating conversion values into your conversion actions is essential. You can build conversion values along with tracking by assigning a fixed value for an assigned action.
Advertisers are now paying attention to campaigns with great spending. Are you thinking about why they are doing so? Let’s reveal it.
They are doing so for:
- Keywords with high spending.
- Terms that converts
- Terms, keywords that convert and attract with high budget and less conversion.
How can you compare attribution models in Google ads?
Comparing attribution model is easy but its setting takes time.
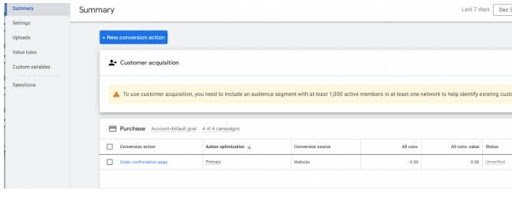
1. Navigate the “Tools and Settings” option in the Google Ads dashboard.
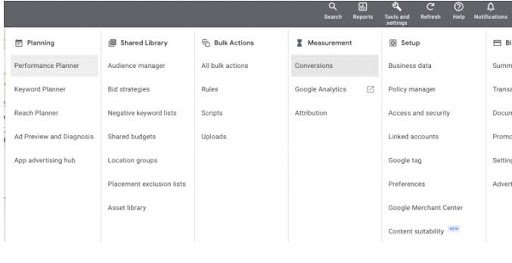
In the next step, click on “Conversion”.
2. You will see different conversion actions on the landing page such as adding something to the cart or performing actions.
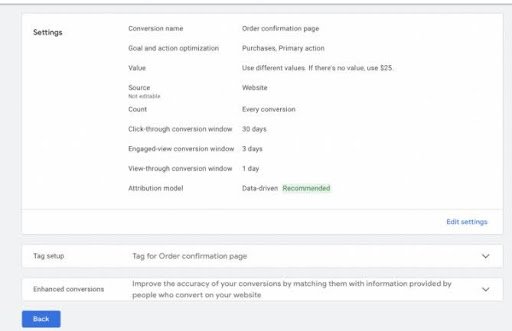
3. You will see a page where to set the conversion type.It can be either data-based,time-decay,first-clicked, or last-click attribution model.
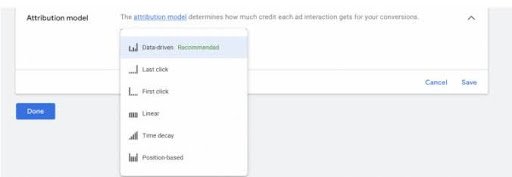
4. Click on the drop-down menu. Google will show you several models. Choose one of them and click “Save “ and then “Done”.
What are different Attribution Model Comparison tools and how can you implement them for effective conversion tracking?
1. Google Analytics 4
Google Analytics 4 is the brand new version of universal Google Analytics.
This new wave of web analytics marks a significant leap forward for marketers, offering them the ability to develop deeper into crucial customer usage metrics beyond mere traffic monitoring.
Google Analytics 4 focuses on privacy- first tracking,cross-channel measurement, and customer privacy.Google Analytics 4 has different engagement sessions as engagement of time,rate, and session.
Google analytics performs three main functions:
- Data Collection
- Data storage
- Data visualisation
Steps for Setting Google Analytics 4
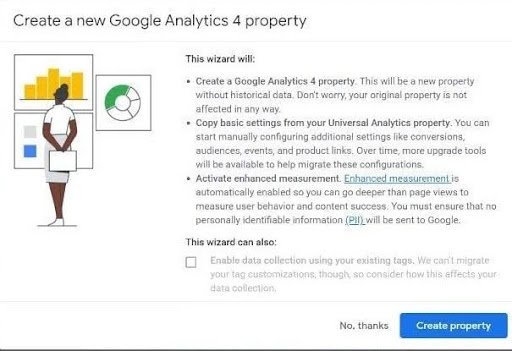
You can create Google Analytics 4 property if your website has universal Google Analytics by using Google Analytics 4 setup assistance.
- Select the required account by clicking on the admin in the Google Analytics.
2. Select the analytics property in the property section
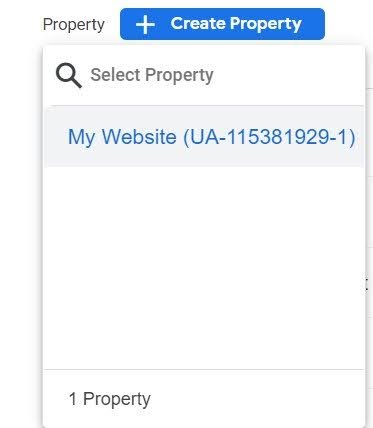
3.Now, select GA4 section assistance.
4.Click “create property section “ by pressing start.
2. Model Comparison Tool
The Model Comparison tool assesses the performance of one or more distinct predictive models by analysing a validation or test dataset. It produces a comprehensive report, including a table outlining fundamental error measurements and another table detailing the prediction results of each model.
It basically compares different attribution models in Google Analytics.
The tool accommodates all binary classification scenarios, where the target variable comprises only two levels, such as “Yes” and “No”. Additionally, it supports multinomial classification, where the target variable has multiple distinct levels or categories.
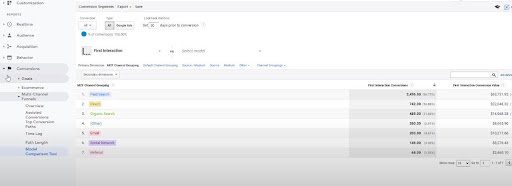
Steps for setting it
- Steer the model comparison tool report in the reporting view of Google Analytics (GA).
- Set the range of your data range to 3 months.
- Compare your last interaction with the last non-direct model
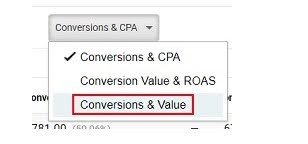
- From the drop-down menu select “ Conversion & Sales”.
5.For organic reach select the % column.
Mistakes occur while Comparing Attribution Models
Comparing attribution model involves a few mistakes that impede the effectiveness of a chosen model. It might involve:
- Neglecting the difference between different attribution models, methodology, and assumptions.
- Neglecting the characteristics of brands, companies, and businesses.
- Relying only on last-click attribution without considering other attribution limits.
- Not able to track interactions across various touch points.
- Inadequate attention to internal and external marketing factors
Conclusion
Comparing attribution model not only provides you detailed analysis of consumers journey.But it also allows you to get budget configuration of all the touchpoints.Multiple touchpoints provides credits to different points in consumers journey from attraction to conversion.
This blog has covered factors for comparing attribution model.You can’t compare attribution models if you don’t have a specific amount of data.You can even compare atleast three touchpoints at a time.
Different tools are there that help you in collecting data,comparing and storage such as Google analytics 4 and Google comparison tool.
Hope this blog is helpful for you. You can even read blog related to multi-touch attribution models and learn more about it.
